- Home
- Departments
- Water Quality Laboratory
- Coastal Water Nutrient Monitoring Program
- Program Introduction
Program Introduction
Summary
The Coastal Water Nutrient Monitoring Program is a collaborative effort by Chatham and surrounding towns, the Pleasant Bay Alliance, UMass-Dartmouth, and other partners to monitor estuarine water quality throughout Chatham and Pleasant Bay. Through decades of data collection on essential indicators such as nitrogen levels, dissolved oxygen, temperature, and water transparency, trained citizen volunteers collect valuable data that are used to track trends of nutrient loading and estuarine health.
This long-term monitoring supports local policy, environmental management, and educational outreach. The program's findings are crucial for guiding local and regional efforts to combat eutrophication (nutrient enrichment), caused primarily by nitrogen from septic systems and fertilizers. By monitoring water quality, the program helps with restoration and protection of estuarine habitats which are critical to recreational and commercial fisheries and shellfisheries, overall estuarine health, resilience from extreme weather, and continued public enjoyment.
Contents
- About the Program
- Program Objectives
- About the Pleasant Bay Alliance
- Why is Water Quality Monitoring Important?
- Types of Water Quality Data Collected by Volunteer Water Watchers
- Eutrophication Index (EI)
- Explaining the Water Quality Graphs
- Map, Graph, and Figures (See the data!)
- References and Websites
- Full PDF Document
About the Program:
The Coastal Water Nutrient Monitoring Program is a cooperative effort of the Chatham Coastal Water Nutrient Monitoring Program and the Pleasant Bay Alliance Monitoring Program. Both Programs include numerous groups and dedicated volunteers:
- Pleasant Bay Alliance (PBA)
- Chatham Department of Natural Resources/Water Quality Laboratory
- Orleans Marine and Freshwater Quality Task Force
- Harwich Shellfish and Marine Water Quality Committee
- Brewster Department of Natural Resources
- Friends of Chatham Waterways
- Friends of Pleasant Bay
- Hundreds of volunteers from the Towns of Chatham, Orleans, Harwich, and Brewster
The success of this Program is dependent on the dedication and time commitment of citizen science volunteers, who are trained in water quality (WQ) monitoring and various support activities. Technical support for the Program is provided by a collaborative partnership among the Towns of Chatham, Harwich, Orleans, and Brewster, and the School of Marine Science and Technology (SMAST) Coastal Systems Program at the University of Massachusetts – Dartmouth.
In Chatham a push for the Program came from local citizens who observed over time that conditions of the water, and the resources within (fish and shellfish, primarily scallops), around Chatham “weren’t as good they’d historically been”. Planning efforts at the time, including the Stage Harbor Management Plan/South Coastal Harbor Management Plan and Pleasant Bay Resource Management Plan, as well as the Chatham’s wastewater and nutrient management planning efforts, identified a significant lack of baseline data across a comprehensive range of WQ indicators and highlighted the absence of a system for monitoring long-term trends. In 1998 the Town of Chatham, in cooperation with the Friends of Chatham Waterways, established an enthusiastic group of “Water Watchers”, citizen scientists to carry out a robust program to collect baseline data in Chatham’s bays and estuaries. The Pleasant Bay Alliance expanded the effort to the entirety of Pleasant Bay in 2000 with cooperation from Harwich, Brewster, and Orleans. Expanding data collection throughout Pleasant Bay was critical as the waterbody is shared by the four Towns, so restoring/protecting the Bay requires actions by all four.
In subsequent years data collected was used as a base for the development of a water quality model by MADEP and SMAST that is linked to a land-use model to help towns understand the impact of development on water quality. This became a substantial effort in all coastal communities known as the Massachusetts Estuaries Project (MEP) that continues to be a significant source of information for communities’ nutrient management planning.
The Monitoring Program remains active today, operating with quality control protocols approved by MA DEP and US EPA, having had the benefit of a generation of trained volunteers who wake early five times throughout summer, pack up their WQ kits, and, in mass, follow the established sampling methods. These volunteers return from their morning sampling with hundreds of samples that are whisked away for analysis at the University of Massachusetts at Dartmouth, School of Marine Science and Technology (SMAST).
Program Objectives:
Provide comprehensive background and ongoing data on water quality
- Monitor nitrogen-loading trends
- Provide data for use in policy, regulatory, and educational applications
- Provide data for WQ modeling (MEP)
- Provide measure of efficacy of mitigation measures
- Document impacts of natural morphological changes (sea level rise, barrier beach breaks, etc.).
About the Pleasant Bay Alliance:
In 1987, the State of Massachusetts officially designated Pleasant Bay and its watershed as an Area of Critical Environmental Concern (ACEC) because of the region’s extraordinary natural resources. A four-town Pleasant Bay Alliance formed, through intermunicipal agreement, as a response to the designation with the Alliance being approved by the Towns of Brewster, Chatham, Harwich, and Orleans. The Alliance has a Steering Committee appointed by the Boards of Selectmen in the four towns. A Technical Resource Committee assists the Steering Committee and consists of resource management professionals from the four towns as well as the Cape Cod Commission, Massachusetts Coastal Zone Management, and the Cape Cod National Seashore. The Steering and Technical Resource Committees work on updating the Resource Management Plan (RMP) every 5 years and work to implement the recommendations of the RMP.
Why is Water Quality Monitoring Important?
The protected bays and estuaries of the Cape serve as a critical “nursery” to nearly 70% of our commercial fisheries species and provide food for migrating birds, marine mammals, as well as local economies. The habitat supports an ecosystem that is integral to the vitality of our coastal communities. These areas also serve as natural defenses that can attenuate storm surge, wave activity, and protect upland areas from erosion. Maintaining good WQ is fundamental in preserving these essential ecosystems.
Long-term monitoring provides valuable insight into the causes of coastal ecosystem degradation, primarily attributed to excess nutrients on Cape Cod. Monitoring results track the positive impacts of the town’s investments into wastewater infrastructure, surface water (stormwater) runoff basins, and reduction of fertilizer use – impacts that may not become apparent for a decade or longer after the initial investment. This delayed effect is due to the slow movement of groundwater containing nutrients (Cape groundwater moves on average one foot per day), particularly those from septic systems and fertilizers, which can take 10 to 20 years or longer to reach coastal estuaries.
The response of coastal aquatic systems to excess nutrient loading is termed “eutrophication”. Nutrients, especially nitrogen in various chemical forms, presently pose the greatest WQ concern in marine waters. On-site septic systems account for 70-80% of nitrogen inputs to coastal waters, with smaller contributions from lawn fertilizers, road run-off, waterfowl, and rainfall. It is not the nutrients themselves that cause problems, but the resulting excessive growth of algae. Once nitrogen compounds reach the water column, they can stimulate the growth of aquatic plants (microscopic phytoplankton and larger algae such as kelp). This excessive plant production can reduce the amount of oxygen in the water column as plant material decomposes and can ultimately lead to anoxic (no oxygen) or hypoxic (low oxygen) conditions. Even brief periods of low oxygen can cause serious stress and damage to bottom-dwelling organisms. Eelgrass, critical to an estuary’s function as a nursery, can be shaded by excessive algal growth to the point of loss, a well-documented problem on Cape Cod since the building boom of the 1950s.
Types of Water Quality Data Collected by Volunteer Water Watchers:
1. Salinity, Temperature, and Dissolved Oxygen (DO)
Salinity, temperature, and dissolved oxygen are essential WQ parameters and are relatively easy and inexpensive to measure. Dissolved oxygen concentrations are measured using dissolved oxygen (DO) meters. Nearly all organisms that live in the water column, or on the seafloor, depend on dissolved oxygen for survival. The DO in water is produced by plants, algae, and other photosynthetic organisms, and is also injected by wave action and diffused into the water from the atmosphere. At night, DO is consumed by the respiration of animals, plants, and microbes. Natural decomposition of dead organic material also decreases the concentration of DO in the water. To capture the lowest level of DO in the water, measurements are taken in the early morning. Temperature is important to measure because it affects the rates of chemical and biochemical reactions in the water. Elevated water temperatures can stress aquatic plants and animals, as warm water holds less DO than cold water, leading to reduced oxygen levels. Temperature is taking on increased importance as we see the effect of global warming with more tropical species seen in the area and several locally important commercial species are moving northward. Salinity data record the concentration of salts in water, typically in units of parts per thousand (PPT). An estuary is the area where freshwater, primarily groundwater on Cape Cod, and open ocean water mix. Low salinity levels within a water body may indicate dilution of the marine water’s saltiness due to recent rainstorms, runoff, or more groundwater discharge. Increased salinity may be caused by evaporation, reduced groundwater seepage or precipitation, or increased tidal flushing with saltier open ocean water.
2. Water Transparency or Secchi Depth
Water transparency is measured using a Secchi Disc, a black and white disc that is lowered into the water and the depth at which the disk “disappears from view” is called the Secchi depth. A Secchi depth measurement is an indirect measure of the light availability for photosynthetic aquatic plants such as algae and eelgrass -- both important food sources and habitat, respectively, for many organisms.
Excessive nutrients in the water column promote algal growth, reducing Secchi depth and limiting sunlight penetration, which can stress or kill the aquatic plants. Excess silt or mud in the water column will also impact light attenuation and fine silt particles can interfere with delicate gills of many aquatic animals.
3. Phytoplankton Pigments (Chlorophyll-a, Pheophytin)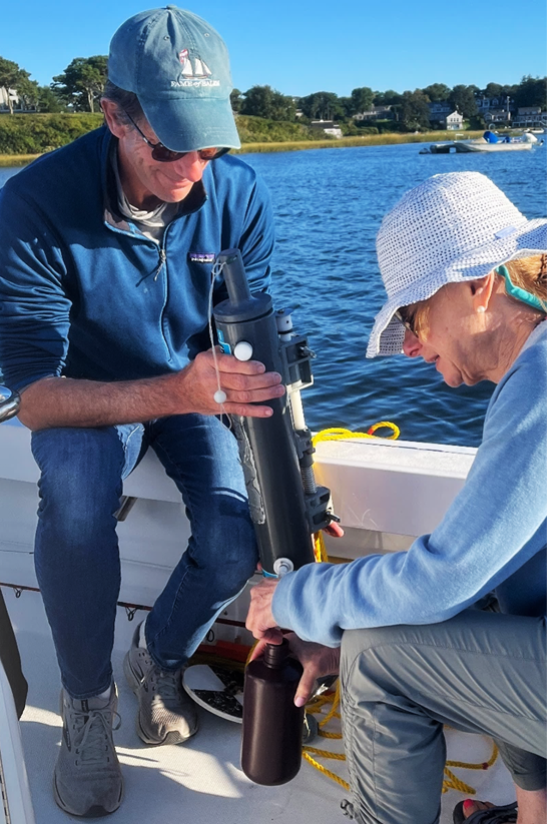
Living and dead phytoplankton (micro algae) contain pigments that cause eutrophic waters to appear green or brown (or red, at times!). The increased green color and reduced transparency of Cape Cod waters each summer is primarily due to increased growth of microalgae. The measurement of the pigments allows for an approximation of phytoplankton concentrations.
4. Dissolved Inorganic Nitrogen (DIN)
The three forms of DIN are: ammonia, nitrite and nitrate. These forms of nitrogen are highly bioavailable to phytoplankton (readily absorbed) and are typically found in low concentrations in coastal waters. Elevated DIN levels are an indication of potential eutrophication.
5. Particulate Organic Nitrogen (PON)
PON is nitrogen that has been incorporated into phytoplankton (microalgae) and zooplankton (microscopic floating animals). DIN is converted into PON in coastal waters by the growth of plants and animals.
6. Dissolved Organic Nitrogen (DON)
DON is a mixture of organic nitrogen compounds (such as amino acids, urea) released by decaying organic matter. DON is an organic form of nitrogen and is less bioavailable to organisms than DIN.
7. Total Organic Nitrogen (TON)
TON is the sum of all organic-bound nitrogen compounds in the water (PON + DON).
8. Total Nitrogen (TN)
Total Nitrogen is widely used as an indicator of eutrophication, representing the sum of both organic and inorganic nitrogen.
9. Other Analyses
Particulate organic carbon (POC), phosphate, and total phosphorus.
Eutrophication Index (EI)
The Eutrophication Index is a management tool used to make relative comparisons among different embayments. The EI graphs are useful to establish baseline information for long-term changes in water quality. As data are collected over decades, statistically significant trends emerge that can potentially be attributed to mitigation activities in the watershed (sewering, stormwater runoff measures, fertilizer regulations, etc.). The EI “scores” five key parameters:
- % oxygen saturation
- water transparency – Secchi depth
- chlorophyll concentration
- Dissolved inorganic nitrogen concentration
- Total organic nitrogen concentration
These parameters respond to nitrogen inputs from human activity. A more detailed description of the Eutrophication Index, its uses, and limitations can be found in Costa et al., 1996.
Explaining the Water Quality Graphs:
The graphs show monitoring results over time for specific locations within the Towns of Chatham, Harwich, Orleans, and Brewster (see map). Data collection began in 1998 in Chatham and 2000 in the other Towns. Some graphs may have gaps due to certain sites not being included in the sampling plan for specific years. Each sample site is represented by two graphs, showing results over time for five key parameters:
- Dissolved Oxygen (% saturation); Dissolved Oxygen (mg/L)
- Nitrogen: DIN, PON, DON (mg/L); Chlorophyl-a and Phaeopigments (ug/L); Eutrophication Index (scaled 0 to 100)
Poorly “flushed” water ways, such as the terminal basins of Mill Pond, Taylors Pond, and Oyster Pond tend to suffer from low DO, high nutrients and chlorophyl levels and, in total, score a low Eutrophic Index value (poor water quality). Conversely, waters that are high in DO tend to be from deeper, colder sites with strong tidal currents, such as Nantucket Sound (CM-7) and near Atlantic Ocean outlets (PBA-1, -19, and -20). Following the breach of the barrier island near Ministers Point in 2007, a statistical analysis of the Pleasant Bay system showed some improvement of WQ, likely due to increased flushing by the colder Atlantic waters, but those positive impacts were not seen in terminal ponds of the Bay. Additionally, some sample locations in the south facing creeks (CM-8, -10, and -12) have likely always been low in DO historically due to high levels of naturally occurring organic matter from the rich marsh and terminal pond systems. In these areas, DO in the shallow waters is rapidly used up by bacterial decomposition of organic matter, and higher temperatures.
Graphs included on this website have not been analyzed to determine whether the trends in water quality improvement or impairment over time are statistically significant. The Pleasant Bay Alliance engaged a consultant to undertake a detailed statistical analysis in 2015 of data from 2000 to 2014 to better understand the effect of the 2007 Nauset Barrier Beach break. The Report is available on the Alliance website.
Maps, Graphs, and Figures:
Click sites below on the interactive map to view documents or access all documents here.